The Spike You Saw Coming But Still Weren't Ready For
Every year, around the same time, the same thing happens. Demand spikes. The plant scrambles. Emergency or short orders go out.
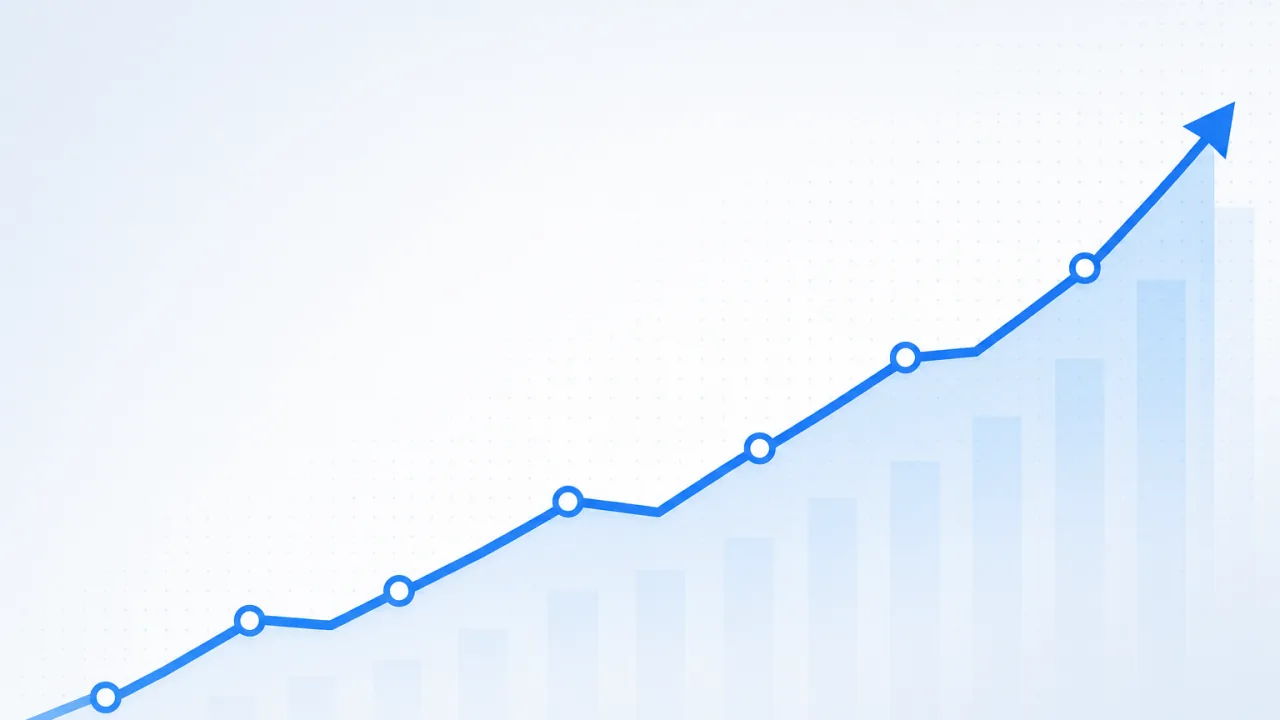
Every year, around the same time, the same thing happens.
Demand spikes. The plant scrambles. Emergency or short orders go out. The team works harder than they should have to. And when it's over, someone pulls up the data from the previous two years and confirms what everyone already knew.
The spike happens every year. Same season. Same customers. Same pattern.
And yet the forecast didn't account for it.
That's the part I keep coming back to. Not that the spike happened. Spikes happen. The market moves, customers order in cycles, seasons drive demand in ways that are specific to every product category and every customer base. That's just the reality of food manufacturing.
What's harder to accept is that the spike was predictable. The data was there. The pattern had repeated itself. And the forecast was still built on a baseline that treated next year like a smoother version of last year rather than a continuation of the curve the operation has actually been running.
Two lines that tell the whole story
There's a way to visualize this that makes the problem immediately obvious.
Draw the forecast. It's a relatively clean line with some variance month to month. A planning baseline. Reasonable on paper, defensible in a budget meeting, utterly disconnected from how the plant actually runs.
Then draw the year. The real one. The line with the spike in March when the big retail customer places their annual promotional order. The drop in July when the summer slow-down hits. The surge in October that everyone in the building knows is coming but somehow never gets fully planned for. The procurement crunch in November when supplier lead times stretch and the December production push is already underway.
Those two lines are almost never the same. And the gap between them isn't random noise. It's a pattern. Consistent, year over year, built into the specific reality of that operation's customers, seasons, and supply chain.
The forecast just isn't reading it.
"We knew the spike was coming. We talk about it every year at the September planning meeting. And every year we still end up short because the forecast didn't build it in properly. It became a running joke that wasn't really funny."
A running joke that wasn't really funny. That sentence describes the forecasting reality in more food manufacturing operations than anyone wants to admit.
Why standard forecasting tools miss the curve
Most forecasting tools used in food manufacturing were not built for food manufacturing.
They were built for general supply chain planning and adapted, sometimes loosely, sometimes through configuration, to food production environments. The underlying logic treats demand as something that trends gradually in one direction or another with some statistical variance around the mean.
Food manufacturing demand doesn't behave that way.
It has hard seasonality. It has customer-driven order cycles that repeat on schedules that are specific to each customer relationship. It has procurement constraints that vary by supplier and by season in ways that affect what can actually be produced regardless of what demand looks like. And it has the accumulated history of how a specific plant, with its specific customer base, has actually run over multiple years.
Generic forecasting tools see none of that. They see numbers. They fit a trend line. They generate a plan that looks statistically reasonable and reflects almost nothing about the lived reality of the operation it's supposed to be serving.
The result is a forecast that the planning team doesn't fully trust. They know it misses the March spike. They know it underestimates the October surge. So they adjust it manually, based on their own knowledge of the operation, and the tool becomes an input rather than an answer.
That's not a forecasting solution. That's a planning team doing the real work with an expensive piece of software as a starting point.
What the data already knows
Here's what's genuinely frustrating about this problem.
The information needed to build an accurate forecast already exists in almost every food manufacturing operation. The sales history is there. The customer order patterns are there. The seasonal curves are there. The procurement lead times and supplier constraints are there.
The pattern of how the plant has actually run over the past two or three years contains everything a good forecasting model needs to get within a meaningful margin of what the operation is actually going to need.
The data knows about the March spike. It's happened before. Multiple times. In roughly the same magnitude, driven by roughly the same customers, at roughly the same point in the annual cycle. A model that reads that history and builds forward from it will get the spike right, or close enough to matter, because the pattern is already established.
What most forecasting tools do instead is treat each year as a fresh start. They look at recent trends and project them forward without interrogating the seasonal structure underneath. The spike looks like an anomaly rather than a feature of the demand curve. And the plan gets built without it.
4% is not a small number
When we talk about Tracktile AI forecasting getting within 4% of what a plant actually needs, it's worth being specific about what that means in practice.
A 4% variance on a significant production run is a manageable buffer. It means ordering with confidence rather than padding every purchase order with a safety margin that ties up working capital. It means scheduling production runs that match actual demand rather than building in cushion that either creates overstock or still falls short at the wrong moment.
The alternative, the variance that most food manufacturers are actually running, is significantly higher. Operations managing forecasting manually or with generic tools commonly see variance of 15 to 25 percent on seasonal peaks. That's not a planning rounding error. That's a structural mismatch between what the plan said and what the plant needed that repeats itself every year and gets absorbed as a cost of doing business.
It doesn't have to be.
"The first time the forecast called the October surge accurately, I actually went back and checked it manually because I assumed it was wrong. It wasn't. That was a strange feeling, trusting a forecast."
Trusting a forecast. That should be the baseline expectation. In too many food manufacturing operations, it's a novel experience.
What changes when the forecast knows your plant
The operational difference between a forecast built on generic trend analysis and one built on the specific demand curve of your operation is not subtle.
It shows up in procurement. Orders go out at the right time, in the right quantities, without the panic buying that happens when the spike arrives and the stock isn't there. Supplier relationships improve because the order patterns become more predictable. Lead time constraints get built into the plan rather than discovered after the purchase order is already late.
It shows up in production scheduling. Runs are planned against real demand rather than adjusted manually every week as the gap between forecast and reality becomes impossible to ignore. The planning team spends less time rebuilding schedules and more time running the operation.
It shows up in inventory. Stock levels reflect what the operation actually needs to meet the demand curve rather than a combination of safety stock, manual adjustment, and educated guessing. The shelves aren't empty during the spike and they aren't carrying three weeks of overstock after the drop.
And it shows up in the planning conversation. The September meeting where everyone talks about the October surge stops being a conversation about hoping the forecast is better this year and starts being a conversation about executing a plan that already accounts for it.
"The October planning meeting felt different this year. We weren't bracing for it. We were just reviewing the plan and confirming we were ready. That's what it's supposed to feel like."
The question worth sitting with
If your planning team already knows the spike is coming every year, why is the forecast still getting caught by it?
The answer, almost always, is that the forecasting tool isn't reading the curve of what your operation has actually done. It's generating a plan from general principles rather than from the specific, accumulated, repeating pattern of your plant's real demand history.
That pattern is in your data right now. Every spike, every drop-off, every seasonal curve, every customer order cycle. It's there, year over year, waiting to be used.
The question is whether the tool managing your forecast is reading it.
Ready to see what your demand curve actually looks like when a forecast is built around it?
Book a demo at book a demo. We'll show you exactly what Tracktile AI forecasting surfaces from your operation's data and what that means for your planning process going forward.
Related Articles

The Moment Production Planning Stops Being A Guess
At some point, every plant manager has that Monday morning moment: "We need to adjust the schedule." It doesn't sound like a big ask.

The Most Expensive Resignation Your Operation Will Ever Face
It usually starts the same way. Someone pulls a plant manager aside on a Friday afternoon. Quiet conversation. Grateful for everything.
Manufacturing analytics and understanding the metrics that matter
Explore how food and beverage manufacturers can harness data analytics to track the metrics that matter, optimize operations, and drive profitability.
Ready to modernize your manufacturing?
See how Tracktile can streamline your operations with a personalized demo.
Book a Demo